Pro Tip: Read Earning Reports More Often
Simplified into three pieces of key information

How do you measure the overall health of a company or business? Stalking their CEO on Twitter? Checking their stock price everyday, or paying for a subscription to MotleyFool? My advice: Tune in to their earnings reports.
A short primer for newbies: A company earnings report is a document that publicly-traded companies must produce every quarter (called a 10-Q) and annually (called a 10-K), outlining their financial position and any other relevant information they want or are required to share. Although the SEC mandates these reports, many private companies also produce them voluntarily to showcase their current business status to existing and potential investors.I like to distill the material presented in earnings reports (which includes webinars, prepared remarks, shareholder letters, earning statements, or investor Q&A sessions) into three key pieces of information. It's important to look at those three together as pieces of a puzzle in order to read between the lines and understand trends over time.
#1: Rear View Execution, and Forward Looking Strategy - Thoroughly read through the CEO's remarks and Investor Q&A in earning transcripts.
Some excerpts from GOOG, Affirm, Hubspot
Google talked a bit about Search and YouTube, gave somewhat small commentary on Android and other investments, but went on and on about Cloud. Surprisingly, they only mentioned AI four times!
Affirm painted a pretty blue sky picture of the future, ambitious plans, but talked about the challenges that come with innovative bets (yawn!) and a tough road ahead in 2022. Basically, a bad year and a bad quarter for them.
Hubspot talked about how the macro environment is changing for SMBs and their newly coined "bimodal" strategy (fancy term!) of focusing on customer volume at the low end while expanding the value of customers at the upper end. We'll see if it works!
Standalone, they are all well-articulated and promising. They are meant to “sell”.
But what you want to look for is
A narrative that does not change between quarters. Look for a narrative that remains consistent between quarters. Pay attention to the company's strategy and focus, rather than getting caught up in new buzzwords introduced each quarter.
Metrics that demonstrate growth, not vanity metrics. Examples of vanity metrics - Google talked about the Pixel 6 and how it's been great to see the response from Pixel users, mentioning that it's the fastest-selling Pixel ever. Affirm reported that they now receive about a billion dollars worth of credit applications in an average week, while Hubspot mentioned that they launched HubSpot Payments a little over a year ago and have seen strong customer interest despite the challenging macro environment. ALL without providing any specific numbers. None of these pieces of information provide additional insight into the overall health of the respective businesses.
More impact, less ideas. When a team has too many ideas in play and lacks focus and execution, it's a red flag (case in point Affirm Investor Deck). A good sign of a healthy execution is ideas described in simple terms and lined up against impact. I look for a few ideas mapping out a roadmap to achieve the goal.
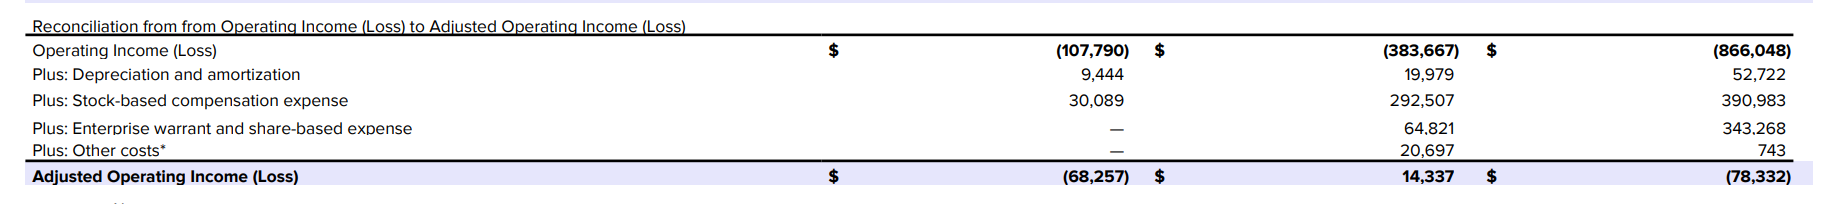
#2: Income - how much money that company has made in a certain period of time. Do I need to say more as to why this is important.
On the 10-Q, the income for the current quarter (compared to previous quarters) is almost always reported. It is important to read the trends here and to understand what is contributing to the net income - cost of revenues, sales and marketing, R&D, and G&A. How are these areas trending, and how do they map to the business model of the company? Evaluate if the trends make sense.
This is your preview into the unit economics of the business. Also, how much can they reinvest in the business for future growth (in research and development, new product lines, marketing and advertising, expanding the company's infrastructure, M&A activity, or hiring more staff)
Not surprising to see losses widening for Hubspot and Affirm in 2022, while Google having positive income, although slowing.


#3: Margin - Simply put, Margin indicates how efficiently a company is using its resources to generate profits.
Within the cost of sales section of the earnings report, you'll find the gross margin, which is calculated as the total net sales minus the cost of those sales. While the gross margin doesn't factor in all other expenses and may not be an accurate representation of the company's actual margin, it provides a useful high-level data point to gauge the width of their margins. If gross margins are shrinking, this could be a cause for concern. It's important to look for trends and investigate the underlying reasons for the change.
Easy to guess below which margin is from Google vs. Affirm.


So, there you have it! Keep these three things in mind and you'll have a pretty good idea of a company's overall health.
To stay in touch with earnigns, add earnings reports to your calendar in Stocks on iPhone.